Question and metric definition
We identify who needs the information, which decisions it supports, and how the measures should be calculated.

Built for what’s next.
14 / TECHNOLOGY & INSIGHT
Turn scattered numbers into clearer decisions.
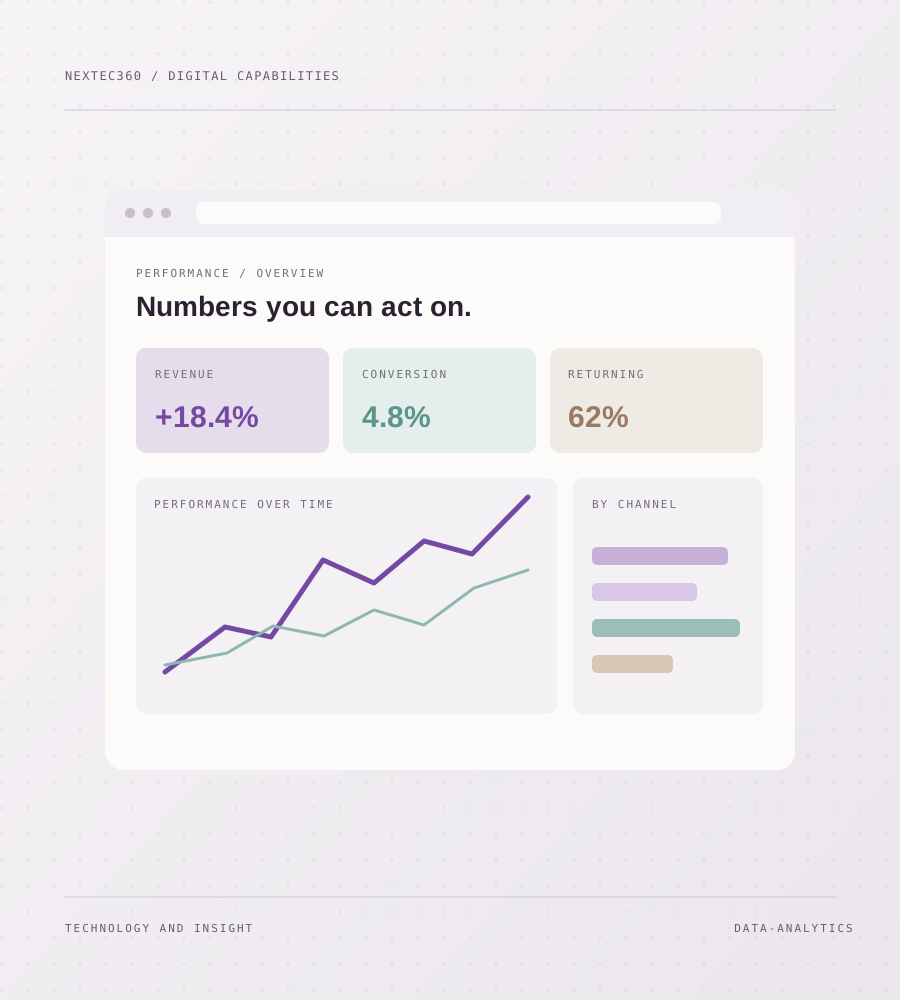
We bring data sources, definitions, and reporting together so teams can see what is happening, ask better questions, and act on information they trust.
01 — THE OPPORTUNITY
When teams use different definitions or copy figures between tools, reports can disagree before anyone reaches a decision. We start by clarifying the question and the underlying data, then design the view that supports it.
02 — THE WORK
Practical work shaped to the brief, with clear outputs at each stage.
We identify who needs the information, which decisions it supports, and how the measures should be calculated.
We inspect available sources, quality, ownership, and gaps before combining information into a report.
We design clear views with appropriate comparisons, filters, and context rather than filling a screen with every available chart.
We document the definitions and update path, then refine reports as teams learn which questions matter most.
03 — ILLUSTRATIVE STARTING BRIEF
Sales, marketing, and operations data live in separate reports, making it hard to see what changed.
Agree on useful measures, connect trustworthy sources, and present the result in a dashboard people can act on.
An example of how we might frame a project, not client work.04 — THE APPROACH
Every project has its own scope. These stages make the work understandable and reviewable from the start.
We start with the business question and the people who need to answer it.
We review source access, quality, and consistency before designing the output.
We create reports and dashboards around the decisions, testing them with the people who will use them.
We document key measures and update responsibilities so the view remains trusted over time.
We define the scope and useful outputs before building. You can review the direction as it develops, and we plan the handover around the people who will own the result. If a different tool or smaller solution is the better fit, that belongs in the conversation too.
06 — PRACTICAL QUESTIONS
The details of a good engagement are specific. Here are a few of the questions we work through early.
Often, if access and integration options are available. We first review the sources and the definitions behind similar-looking fields.
Not necessarily. A focused reporting layer may be enough. The appropriate architecture depends on volume, quality, security, and how the data will be used.
We identify what can be answered reliably now, what requires cleanup, and where a new collection process would help.
HAVE A PROJECT IN MIND?
Tell us what you are trying to improve. We’ll talk through the scope, the decisions to make, and the most sensible first step.